Graph
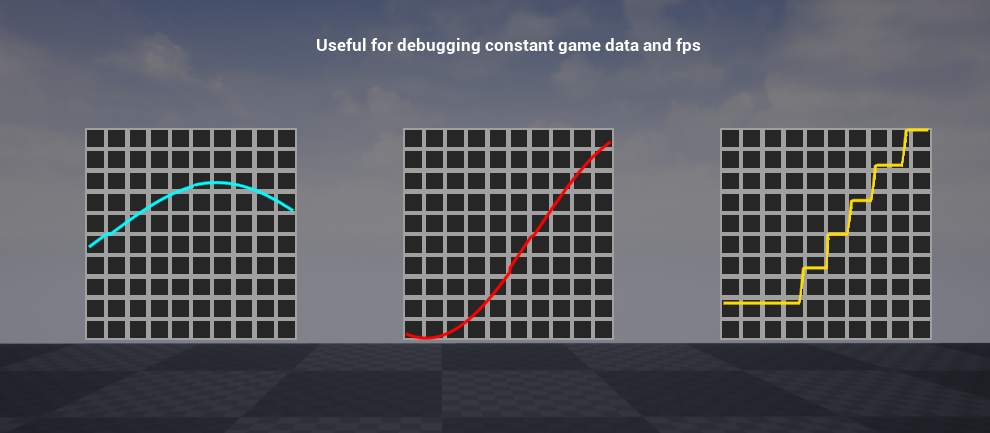
Graph is an image widget which can draw an array of lines on top of the background useful for tracking and debugging constant data and looking for irregular spikes.
` Examples are in WB_Graphs widget in plugin content`
How to use
- Add graph widget to your widget.
- Use add point in the end and provide data in range of -1 and 1
Properties
| Name | Type | Description |
|---|---|---|
| ConsistentLine | bool | Determines whether the line should be consistent from left to right without any cuts regardless of the data. |
| GraphScrollSpeed | float | Automatic scrolling speed for each frame. |
| LinearColor | FLinearColor | Color of the line. |
| LineSize | float | Size of the line. |
| AddPoint | Function | Adds a point to the graph where X is time and Y is location (Ranges from -1 to 1). |
| AddPointInTheEnd | Function | Adds a point at X = 1 and Y (Y is specified as a parameter). |
| ManualScroll | Function | Manually scrolls the graph across the X axis by a specified amount. |